First Simulation#
This tutorial guides you through a simple communication simulation using comnumpy. You will build a basic QAM communication chain, transmit symbols through an AWGN channel, and evaluate the Symbol Error Rate (SER).
What you’ll learn:
Creating a communication chain using
Sequentialand built-in processors.Transmitting QAM symbols through an AWGN channel.
Measuring the Symbol Error Rate (SER) and comparing it with theory.
Using
Recorderobjects to capture and visualize signals.
Introduction#
Prerequisites#
Make sure you have the following Python libraries installed:
numpy
matplotlib
comnumpy
Import Libraries#
We start by importing the necessary libraries:
import numpy as np
import matplotlib.pyplot as plt
from comnumpy.core import Sequential, Recorder
from comnumpy.core.generators import SymbolGenerator
from comnumpy.core.mappers import SymbolMapper, SymbolDemapper
from comnumpy.core.utils import get_alphabet
from comnumpy.core.channels import AWGN
from comnumpy.core.metrics import compute_ser, compute_metric_awgn_theo
Define Parameters#
Next, we define the key simulation parameters: the modulation order, the number of transmitted symbols, and the signal-to-noise ratio (SNR):
# parameters
modulation = "QAM"
M = 4       # Modulation order (4-QAM)
N = 10000   # Number of symbols
snr_dB = 10 # Signal-to-Noise Ratio in dB

alphabet = get_alphabet(modulation, M)
AWGN Communication Chain#
Define the Chain#
We define the communication chain using the Sequential object, which takes a list of
processors as input. The comnumpy library provides a wide range of built-in processors
for modulation, coding, channel modeling, and more.
# define a communication chain
chain = Sequential([
            SymbolGenerator(M),
            Recorder(name="recorder_tx"),
            SymbolMapper(alphabet),
            AWGN(value=snr_dB, unit="snr_dB"),
            Recorder(name="recorder_rx"),
            SymbolDemapper(alphabet)
        ])
In this simulation, the communication chain is composed of six processor objects:
        graph LR;
   A[Generator] --> B[Recorder];
   B --> C[Mapper];
   C --> D[AWGN];
   D --> E[Recorder];
   E --> F[Demapper];
SymbolGeneratorGenerates a sequence of random integers in the range \([0, M-1]\), where each integer represents a symbol to transmit.RecorderCaptures the signal at a specific point in the chain for later analysis (e.g., comparing transmitted vs. received data).SymbolMapperMaps each integer symbol to a point in the complex QAM constellation.AWGNSimulates an Additive White Gaussian Noise channel, modeling the effect of thermal noise on the transmitted signal.SymbolDemapperPerforms hard-decision demapping by associating each received point with the nearest constellation symbol.Recorder(second instance) A second recorder placed after the channel captures the noisy received symbols for visualization (e.g., constellation diagrams).
Simulate the Chain#
To run the simulation, simply call the Sequential object with the desired number of symbols:
# test chain
y = chain(N)
Evaluate Performance#
We evaluate the performance of the communication system by computing the Symbol Error Rate (SER) from the transmitted and detected symbols, then comparing it with the theoretical value.
To retrieve the transmitted symbols, we call the get_data() method on the Recorder object.
Recorders can be placed at any point in the chain, depending on which signal you want to inspect.
# estimate simulation performance
data_tx = chain["recorder_tx"].get_data()
ser = compute_ser(data_tx, y)

# extract theoretical performance
snr_per_bit = (10**(snr_dB/10))/np.log2(M)
ser_theo = compute_metric_awgn_theo(modulation, M, snr_per_bit, "ser")

# display results
print(f"SER (simu)= {ser}")
print(f"SER (theo)= {ser_theo}")
For this simulation, typical output looks like:
SER (simu) = 0.0013
SER (theo) = 0.0015647896369451741
Note: for small SER values, increasing N (the number of transmitted symbols)
improves the estimation accuracy.
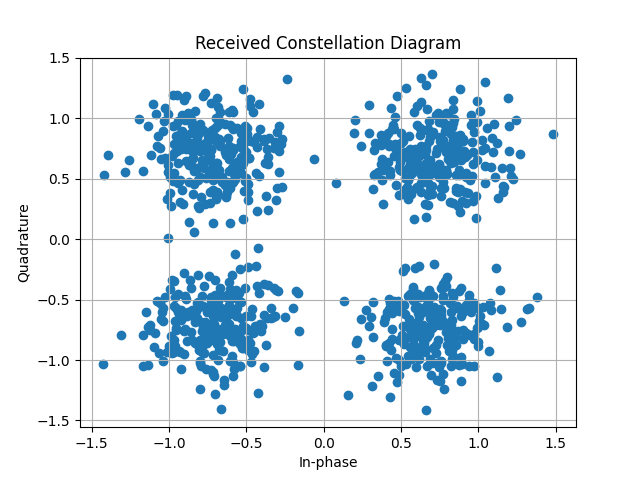
Plot the Constellation#
Visualizing the received constellation is a useful way to assess signal quality.
We use a Recorder object to capture the received symbols and plot them
with matplotlib:
# plot signals
data_rx = chain["recorder_rx"].get_data()
plt.scatter(np.real(data_rx), np.imag(data_rx))
plt.title("Received Constellation Diagram")
plt.xlabel("In-phase")
plt.ylabel("Quadrature")
plt.grid(True)
Conclusion#
You have successfully built and simulated your first communication chain with comnumpy.
From here, you can explore:
The OFDM and MIMO tutorials for more advanced communication techniques.
The API reference for a complete list of available processors.
Different modulation orders, SNR values, and channel models to deepen your understanding.